Two Way Tables Project
8.SP.4 Understand that patterns of association can also be seen in bivariate categorical data by displaying frequencies and relative frequencies in a two-way table. Construct and interpret a two-way table summarizing data on two categorical variables collected from the same subjects. Use relative frequencies calculated for rows or columns to describe possible association between the two variables. For example, collect data from students in your class on whether or not they have a curfew on school nights and whether or not they have assigned chores at home. Is there evidence that those who have a curfew also tend to have chores?
1) Rewrite the standard in your own words. How does this assignment relate to the standard?
This standard asks for me to understand two way tables and two way frequency tables. This assignment was basically to taking data from some people on their ages and social media and creating two way frequency tables. Once I got my data, I had to use the data collected to make it into a two way table to compare data I have collected, using the tables. So, the standard and assignment relates.
2) What are the steps you took to complete and do well on this assignment?
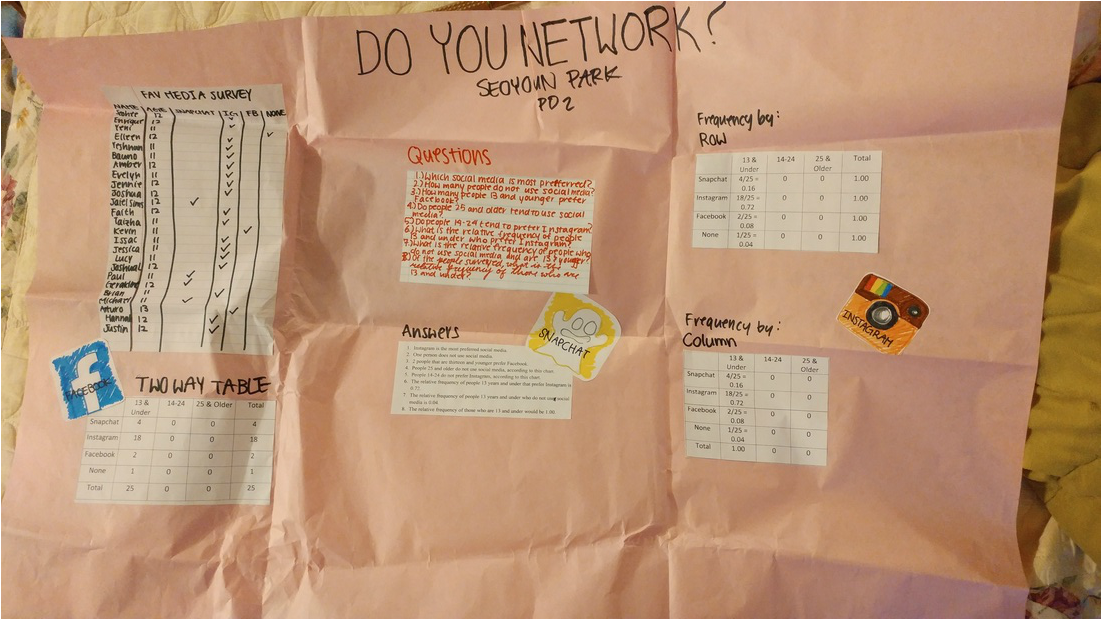
To do this assignment, I had to go around asking people at school about their most used social media and their ages. After I got those, I made that info int a two way chart, and a frequency chart. With that data, I answered the questions and then typed up my data and pasted pictures and the data onto a pink paper sheet.
3) This assignment demonstrates the following strengths...
This assignment demonstrates that I understand two way frequency tables. Also, it shows I can record data. It also shows I can collect data from people. The project also shows I am able to
4) I could have improved my work on this assignment by...
I could have improved work on this assignment by making my poster more presentable. It looks so blank. I could have also not glued the pictures last minute onto a paper I got from the teacher's lounge. I could manage my time better next time. I also could have included more varieties of ages, since I only took poll on a bunch of sixth graders and nobody else. My project came out biased and unreliable for that reason.
5) How will you apply the skills you learned from this assignment in either the real world when you are an adult or in other classes while you are still a student?
In the real world, taking data and polls and stuff will be important. So, the two way chart thing will come in handy later on.
This standard asks for me to understand two way tables and two way frequency tables. This assignment was basically to taking data from some people on their ages and social media and creating two way frequency tables. Once I got my data, I had to use the data collected to make it into a two way table to compare data I have collected, using the tables. So, the standard and assignment relates.
2) What are the steps you took to complete and do well on this assignment?
To do this assignment, I had to go around asking people at school about their most used social media and their ages. After I got those, I made that info int a two way chart, and a frequency chart. With that data, I answered the questions and then typed up my data and pasted pictures and the data onto a pink paper sheet.
3) This assignment demonstrates the following strengths...
This assignment demonstrates that I understand two way frequency tables. Also, it shows I can record data. It also shows I can collect data from people. The project also shows I am able to
4) I could have improved my work on this assignment by...
I could have improved work on this assignment by making my poster more presentable. It looks so blank. I could have also not glued the pictures last minute onto a paper I got from the teacher's lounge. I could manage my time better next time. I also could have included more varieties of ages, since I only took poll on a bunch of sixth graders and nobody else. My project came out biased and unreliable for that reason.
5) How will you apply the skills you learned from this assignment in either the real world when you are an adult or in other classes while you are still a student?
In the real world, taking data and polls and stuff will be important. So, the two way chart thing will come in handy later on.